Mutate
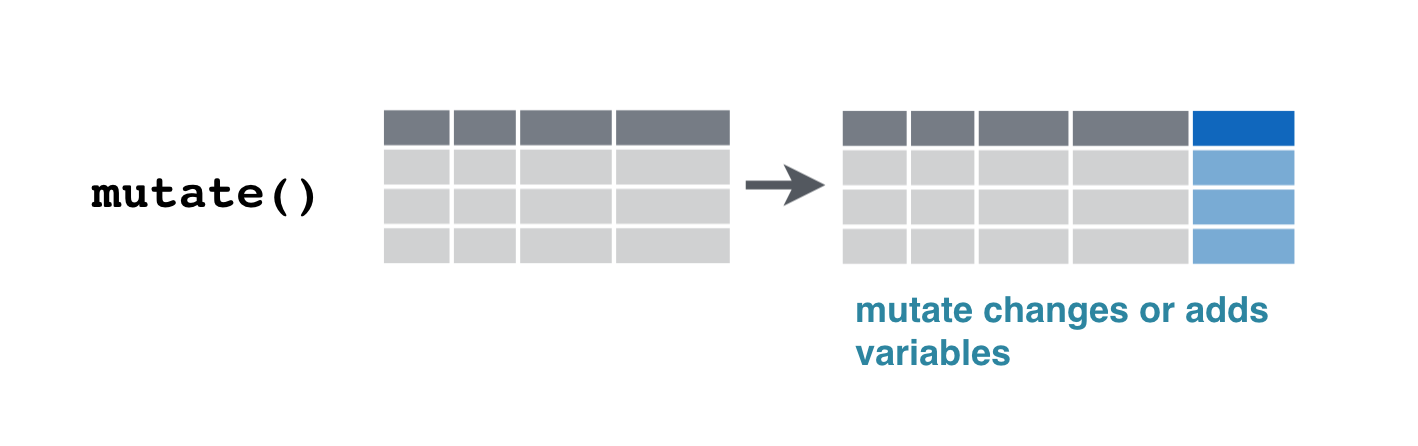
Using mutate to change a variable
(music_top200
  >> mutate(streams = _.streams / 1000)
)Using mutate to change a variable
(music_top200
  >> mutate(streams = _.streams / 1000)
)
Using mutate to change a variable
(music_top200
  >> mutate(streams = _.streams / 1000)
)
Using mutate to change a variable (result)
(music_top200
  >> mutate(streams = _.streams / 1000)
)| country | position | track_name | artist | streams | duration | continent | |
|---|---|---|---|---|---|---|---|
| 0 | Argentina | 1 | Tusa | KAROL G | 1858.666 | 200.960 | Americas |
| 1 | Argentina | 2 | Tattoo | Rauw Alejandro | 1344.382 | 202.887 | Americas |
| 2 | Argentina | 3 | Hola - Remix | Dalex | 1330.011 | 249.520 | Americas |
| ... | ... | ... | ... | ... | ... | ... | ... |
| 12397 | South Africa | 198 | Black And White | Niall Horan | 11.771 | 193.090 | Africa |
| 12398 | South Africa | 199 | When I See U | Fantasia | 11.752 | 217.347 | Africa |
| 12399 | South Africa | 200 | Psycho! | MASN | 11.743 | 197.217 | Africa |
12400 rows × 7 columns
Using mutate to add a new variable
(music_top200
  >> mutate(ttl_stream_time = _.streams * _.duration)
)| country | position | track_name | artist | streams | duration | continent | ttl_stream_time | |
|---|---|---|---|---|---|---|---|---|
| 0 | Argentina | 1 | Tusa | KAROL G | 1858666 | 200.960 | Americas | 3.735175e+08 |
| 1 | Argentina | 2 | Tattoo | Rauw Alejandro | 1344382 | 202.887 | Americas | 2.727576e+08 |
| 2 | Argentina | 3 | Hola - Remix | Dalex | 1330011 | 249.520 | Americas | 3.318643e+08 |
| ... | ... | ... | ... | ... | ... | ... | ... | ... |
| 12397 | South Africa | 198 | Black And White | Niall Horan | 11771 | 193.090 | Africa | 2.272862e+06 |
| 12398 | South Africa | 199 | When I See U | Fantasia | 11752 | 217.347 | Africa | 2.554262e+06 |
| 12399 | South Africa | 200 | Psycho! | MASN | 11743 | 197.217 | Africa | 2.315919e+06 |
12400 rows × 8 columns
Using mutate to add a new variable (result)
(music_top200
  >> mutate(ttl_stream_time = _.streams * _.duration)
)
| country | position | track_name | artist | streams | duration | continent | ttl_stream_time | |
|---|---|---|---|---|---|---|---|---|
| 0 | Argentina | 1 | Tusa | KAROL G | 1858666 | 200.960 | Americas | 3.735175e+08 |
| 1 | Argentina | 2 | Tattoo | Rauw Alejandro | 1344382 | 202.887 | Americas | 2.727576e+08 |
| 2 | Argentina | 3 | Hola - Remix | Dalex | 1330011 | 249.520 | Americas | 3.318643e+08 |
| ... | ... | ... | ... | ... | ... | ... | ... | ... |
| 12397 | South Africa | 198 | Black And White | Niall Horan | 11771 | 193.090 | Africa | 2.272862e+06 |
| 12398 | South Africa | 199 | When I See U | Fantasia | 11752 | 217.347 | Africa | 2.554262e+06 |
| 12399 | South Africa | 200 | Psycho! | MASN | 11743 | 197.217 | Africa | 2.315919e+06 |
12400 rows × 8 columns
Answering a question
(music_top200
  >> mutate(ttl_stream_time = _.streams * _.duration)
  >> filter(_.country == "Costa Rica")
  >> arrange(-_.ttl_stream_time)
)Answering a question
(music_top200
  >> mutate(ttl_stream_time = _.streams * _.duration)


)| country | position | track_name | artist | streams | duration | continent | ttl_stream_time | |
|---|---|---|---|---|---|---|---|---|
| 0 | Argentina | 1 | Tusa | KAROL G | 1858666 | 200.960 | Americas | 3.735175e+08 |
| 1 | Argentina | 2 | Tattoo | Rauw Alejandro | 1344382 | 202.887 | Americas | 2.727576e+08 |
| 2 | Argentina | 3 | Hola - Remix | Dalex | 1330011 | 249.520 | Americas | 3.318643e+08 |
| ... | ... | ... | ... | ... | ... | ... | ... | ... |
| 12397 | South Africa | 198 | Black And White | Niall Horan | 11771 | 193.090 | Africa | 2.272862e+06 |
| 12398 | South Africa | 199 | When I See U | Fantasia | 11752 | 217.347 | Africa | 2.554262e+06 |
| 12399 | South Africa | 200 | Psycho! | MASN | 11743 | 197.217 | Africa | 2.315919e+06 |
12400 rows × 8 columns
Answering a question
(music_top200
  >> mutate(ttl_stream_time = _.streams * _.duration)
  >> filter(_.country == "Costa Rica")

)| country | position | track_name | artist | streams | duration | continent | ttl_stream_time | |
|---|---|---|---|---|---|---|---|---|
| 2200 | Costa Rica | 1 | Safaera | Bad Bunny | 338078 | 295.177 | Americas | 9.979285e+07 |
| 2201 | Costa Rica | 2 | Si Veo a Tu Mamá | Bad Bunny | 244932 | 170.972 | Americas | 4.187651e+07 |
| 2202 | Costa Rica | 3 | Ignorantes | Bad Bunny | 233113 | 210.607 | Americas | 4.909523e+07 |
| ... | ... | ... | ... | ... | ... | ... | ... | ... |
| 2397 | Costa Rica | 198 | Ride It | Regard | 21731 | 157.606 | Americas | 3.424936e+06 |
| 2398 | Costa Rica | 199 | Sola | Manuel Turizo | 21704 | 195.044 | Americas | 4.233235e+06 |
| 2399 | Costa Rica | 200 | Nena Maldición (feat. Lenny Tavárez) | Paulo Londra | 21684 | 228.875 | Americas | 4.962926e+06 |
200 rows × 8 columns
Answering a question
(music_top200
  >> mutate(ttl_stream_time = _.streams * _.duration)
  >> filter(_.country == "Costa Rica")
  >> arrange(-_.ttl_stream_time)
)| country | position | track_name | artist | streams | duration | continent | ttl_stream_time | |
|---|---|---|---|---|---|---|---|---|
| 2200 | Costa Rica | 1 | Safaera | Bad Bunny | 338078 | 295.177 | Americas | 9.979285e+07 |
| 2202 | Costa Rica | 3 | Ignorantes | Bad Bunny | 233113 | 210.607 | Americas | 4.909523e+07 |
| 2222 | Costa Rica | 23 | René | Residente | 101872 | 457.592 | Americas | 4.661581e+07 |
| ... | ... | ... | ... | ... | ... | ... | ... | ... |
| 2377 | Costa Rica | 178 | Dónde Estás | KHEA | 23177 | 153.560 | Americas | 3.559060e+06 |
| 2394 | Costa Rica | 195 | Blueberry Faygo | Lil Mosey | 21771 | 162.547 | Americas | 3.538811e+06 |
| 2397 | Costa Rica | 198 | Ride It | Regard | 21731 | 157.606 | Americas | 3.424936e+06 |
200 rows × 8 columns
Answering a question (result)
(music_top200
  >> mutate(ttl_stream_time = _.streams * _.duration)
  >> filter(_.country == "Costa Rica")
  >> arrange(-_.ttl_stream_time)
)| country | position | track_name | artist | streams | duration | continent | ttl_stream_time | |
|---|---|---|---|---|---|---|---|---|
| 2200 | Costa Rica | 1 | Safaera | Bad Bunny | 338078 | 295.177 | Americas | 9.979285e+07 |
| 2202 | Costa Rica | 3 | Ignorantes | Bad Bunny | 233113 | 210.607 | Americas | 4.909523e+07 |
| 2222 | Costa Rica | 23 | René | Residente | 101872 | 457.592 | Americas | 4.661581e+07 |
| ... | ... | ... | ... | ... | ... | ... | ... | ... |
| 2377 | Costa Rica | 178 | Dónde Estás | KHEA | 23177 | 153.560 | Americas | 3.559060e+06 |
| 2394 | Costa Rica | 195 | Blueberry Faygo | Lil Mosey | 21771 | 162.547 | Americas | 3.538811e+06 |
| 2397 | Costa Rica | 198 | Ride It | Regard | 21731 | 157.606 | Americas | 3.424936e+06 |
200 rows × 8 columns
Let's practice!
Exercise 0:
Delete the # symbol on the line # music_top200. This symbol is called a comment, and causes everything to the right of it to be ignored.
Exercise 1:
Currently, the duration is calculated in seconds.
- Delete (uncomment) the
#symbol in the code. - Complete the code to convert duration to milliseconds.
hint
> Delete the # symbol. This is called a comment. When it is the first non-blank on a line, it stops that line from being run. > 1 second is 1000 milliseconds. So you would multiply the duration by 1000.| country | position | track_name | artist | streams | duration | continent | |
|---|---|---|---|---|---|---|---|
| 0 | Argentina | 1 | Tusa | KAROL G | 1858666 | 200.960 | Americas |
| 1 | Argentina | 2 | Tattoo | Rauw Alejandro | 1344382 | 202.887 | Americas |
| 2 | Argentina | 3 | Hola - Remix | Dalex | 1330011 | 249.520 | Americas |
| ... | ... | ... | ... | ... | ... | ... | ... |
| 12397 | South Africa | 198 | Black And White | Niall Horan | 11771 | 193.090 | Africa |
| 12398 | South Africa | 199 | When I See U | Fantasia | 11752 | 217.347 | Africa |
| 12399 | South Africa | 200 | Psycho! | MASN | 11743 | 197.217 | Africa |
12400 rows × 7 columns
Exercise 2:
Uncomment the mutate in the pipe below. Can you fix the two errors in it?
It should return data with a new column on the right, that divides position by 200.
| country | position | track_name | artist | streams | duration | continent | |
|---|---|---|---|---|---|---|---|
| 0 | Argentina | 1 | Tusa | KAROL G | 1858666 | 200.960 | Americas |
| 1 | Argentina | 2 | Tattoo | Rauw Alejandro | 1344382 | 202.887 | Americas |
| 2 | Argentina | 3 | Hola - Remix | Dalex | 1330011 | 249.520 | Americas |
| ... | ... | ... | ... | ... | ... | ... | ... |
| 12397 | South Africa | 198 | Black And White | Niall Horan | 11771 | 193.090 | Africa |
| 12398 | South Africa | 199 | When I See U | Fantasia | 11752 | 217.347 | Africa |
| 12399 | South Africa | 200 | Psycho! | MASN | 11743 | 197.217 | Africa |
12400 rows × 7 columns
Exercise 3:
The mutate below uses code from a future chapter to calculate how many letters are in each artist's name.
Which artist with the shortest name has the most streams?
hint
> You'll need to use an arrange in the pipe with 2 arguments.| country | position | track_name | artist | streams | duration | continent | artist_length | |
|---|---|---|---|---|---|---|---|---|
| 0 | Argentina | 1 | Tusa | KAROL G | 1858666 | 200.960 | Americas | 7 |
| 1 | Argentina | 2 | Tattoo | Rauw Alejandro | 1344382 | 202.887 | Americas | 14 |
| 2 | Argentina | 3 | Hola - Remix | Dalex | 1330011 | 249.520 | Americas | 5 |
| ... | ... | ... | ... | ... | ... | ... | ... | ... |
| 12397 | South Africa | 198 | Black And White | Niall Horan | 11771 | 193.090 | Africa | 11 |
| 12398 | South Africa | 199 | When I See U | Fantasia | 11752 | 217.347 | Africa | 8 |
| 12399 | South Africa | 200 | Psycho! | MASN | 11743 | 197.217 | Africa | 4 |
12400 rows × 8 columns
Test yourself
(click to answer)