Summarize
Summarizing data
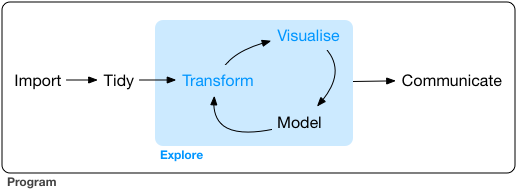
Data analysis
Extracting data
(music_top200
  >> filter(_.country == "Japan", _.position == 1)
)| country | position | track_name | artist | streams | duration | continent | |
|---|---|---|---|---|---|---|---|
| 6400 | Japan | 1 | I LOVE... | Official HIGE DANdism | 1591844 | 282.027 | Asia |
The summarize verb
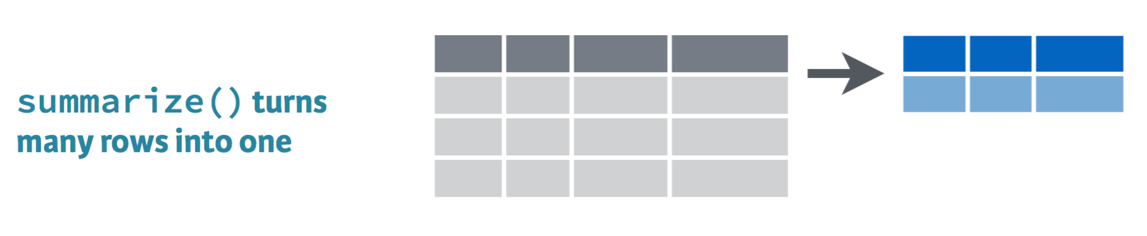
(music_top200
  >> summarize(avg_duration = _.duration.mean())
)| avg_duration | |
|---|---|
| 0 | 205.990073 |
The summarize verb
(music_top200
  >> summarize(avg_duration = _.duration.mean())
)| avg_duration | |
|---|---|
| 0 | 205.990073 |
The summarize verb
(music_top200
  >> summarize(avg_duration = _.duration.mean())
)| avg_duration | |
|---|---|
| 0 | 205.990073 |
Summarizing one country
(music_top200
  >> filter(_.country == "Japan")
  >> summarize(avg_duration = _.duration.mean())
)| avg_duration | |
|---|---|
| 0 | 250.53499 |
Summarizing into multiple columns
(music_top200
  >> filter(_.country == "Japan")
  >> summarize(
      avg_duration = _.duration.mean(),
      ttl_streams = _.streams.sum()
  )
)| avg_duration | ttl_streams | |
|---|---|---|
| 0 | 250.53499 | 48942067 |
Methods for summarizing
E.g. _.some_column.mean()
.mean().sum().median().min().max()
Let's practice!
Exercise 1:
The code below calculates the average duration.
- Uncomment the summarize verb.
- Change it to calculate median duration.
- Make sure to change the resulting column name to indicate its a median.
| country | position | track_name | artist | streams | duration | continent | |
|---|---|---|---|---|---|---|---|
| 0 | Argentina | 1 | Tusa | KAROL G | 1858666 | 200.960 | Americas |
| 1 | Argentina | 2 | Tattoo | Rauw Alejandro | 1344382 | 202.887 | Americas |
| 2 | Argentina | 3 | Hola - Remix | Dalex | 1330011 | 249.520 | Americas |
| ... | ... | ... | ... | ... | ... | ... | ... |
| 12397 | South Africa | 198 | Black And White | Niall Horan | 11771 | 193.090 | Africa |
| 12398 | South Africa | 199 | When I See U | Fantasia | 11752 | 217.347 | Africa |
| 12399 | South Africa | 200 | Psycho! | MASN | 11743 | 197.217 | Africa |
12400 rows × 7 columns
Q: what is the median duration?
answer
201.084Q: Add a second argument to summarize, which calculates the sum of streams. How large is it?
answer
301,822,525Exercise 2:
Use verbs you learned in chapter 1 to do the following:
- find the track with the lowest duration
- subset the data to keep only the row for that track
(Note, you may need to run code multiple times)
| country | position | track_name | artist | streams | duration | continent | |
|---|---|---|---|---|---|---|---|
| 0 | Argentina | 1 | Tusa | KAROL G | 1858666 | 200.960 | Americas |
| 1 | Argentina | 2 | Tattoo | Rauw Alejandro | 1344382 | 202.887 | Americas |
| 2 | Argentina | 3 | Hola - Remix | Dalex | 1330011 | 249.520 | Americas |
| ... | ... | ... | ... | ... | ... | ... | ... |
| 12397 | South Africa | 198 | Black And White | Niall Horan | 11771 | 193.090 | Africa |
| 12398 | South Africa | 199 | When I See U | Fantasia | 11752 | 217.347 | Africa |
| 12399 | South Africa | 200 | Psycho! | MASN | 11743 | 197.217 | Africa |
12400 rows × 7 columns
Now, use summarize to calculate the min duration, and the max duration directly.
| country | position | track_name | artist | streams | duration | continent | |
|---|---|---|---|---|---|---|---|
| 0 | Argentina | 1 | Tusa | KAROL G | 1858666 | 200.960 | Americas |
| 1 | Argentina | 2 | Tattoo | Rauw Alejandro | 1344382 | 202.887 | Americas |
| 2 | Argentina | 3 | Hola - Remix | Dalex | 1330011 | 249.520 | Americas |
| ... | ... | ... | ... | ... | ... | ... | ... |
| 12397 | South Africa | 198 | Black And White | Niall Horan | 11771 | 193.090 | Africa |
| 12398 | South Africa | 199 | When I See U | Fantasia | 11752 | 217.347 | Africa |
| 12399 | South Africa | 200 | Psycho! | MASN | 11743 | 197.217 | Africa |
12400 rows × 7 columns
Why would you use summarize like this, rather than the arrange and filter approach?
(click to answer)
Exercise 3:
The examples below show what happens verbs like filter and mutate use methods like .mean().
| country | position | track_name | artist | streams | duration | continent | avg_streams | |
|---|---|---|---|---|---|---|---|---|
| 0 | Argentina | 1 | Tusa | KAROL G | 1858666 | 200.960 | Americas | 243405.2625 |
| 1 | Argentina | 2 | Tattoo | Rauw Alejandro | 1344382 | 202.887 | Americas | 243405.2625 |
| 2 | Argentina | 3 | Hola - Remix | Dalex | 1330011 | 249.520 | Americas | 243405.2625 |
| ... | ... | ... | ... | ... | ... | ... | ... | ... |
| 12397 | South Africa | 198 | Black And White | Niall Horan | 11771 | 193.090 | Africa | 243405.2625 |
| 12398 | South Africa | 199 | When I See U | Fantasia | 11752 | 217.347 | Africa | 243405.2625 |
| 12399 | South Africa | 200 | Psycho! | MASN | 11743 | 197.217 | Africa | 243405.2625 |
12400 rows × 8 columns
| country | position | track_name | artist | streams | duration | continent | |
|---|---|---|---|---|---|---|---|
| 108 | Argentina | 109 | Me Gusta | Ciro y los Persas | 243159 | 289.093 | Americas |
| 109 | Argentina | 110 | Tal Vez | Paulo Londra | 242870 | 264.483 | Americas |
| 110 | Argentina | 111 | Physical | Dua Lipa | 239225 | 193.829 | Americas |
| ... | ... | ... | ... | ... | ... | ... | ... |
| 12397 | South Africa | 198 | Black And White | Niall Horan | 11771 | 193.090 | Africa |
| 12398 | South Africa | 199 | When I See U | Fantasia | 11752 | 217.347 | Africa |
| 12399 | South Africa | 200 | Psycho! | MASN | 11743 | 197.217 | Africa |
9341 rows × 7 columns
Based on the examples above, can you use only the filter verb to get the most streamed song in all the data?
| country | position | track_name | artist | streams | duration | continent | |
|---|---|---|---|---|---|---|---|
| 0 | Argentina | 1 | Tusa | KAROL G | 1858666 | 200.960 | Americas |
| 1 | Argentina | 2 | Tattoo | Rauw Alejandro | 1344382 | 202.887 | Americas |
| 2 | Argentina | 3 | Hola - Remix | Dalex | 1330011 | 249.520 | Americas |
| ... | ... | ... | ... | ... | ... | ... | ... |
| 12397 | South Africa | 198 | Black And White | Niall Horan | 11771 | 193.090 | Africa |
| 12398 | South Africa | 199 | When I See U | Fantasia | 11752 | 217.347 | Africa |
| 12399 | South Africa | 200 | Psycho! | MASN | 11743 | 197.217 | Africa |
12400 rows × 7 columns
| country | position | track_name | artist | streams | duration | continent | |
|---|---|---|---|---|---|---|---|
| 7800 | United States | 1 | The Box | Roddy Ricch | 12987027 | 196.653 | Americas |
1 rows × 7 columns